
Article by Emma Turner (ECMWF)
A new extra-large set of diverse atmospheric profiles has recently been compiled by the NWP SAF and is now available to the scientific community for the first time in nearly 10 years. Comprised of a year of ECMWF Copernicus Atmospheric Monitoring Service (CAMS) forecast data on 137 levels, the profiles represent one of the most up-to-date estimates of the vertical structure of several significant meteorological variables, atmospheric gases and aerosols. Each subset of 5,000 thermodynamically consistent profiles is meticulously selected to form a microcosm of the full model, optimised for 20 important atmospheric variables. The dataset can be used to train or validate a variety of model applications and is suitable for input to the latest version of RadSim.
25 years of profile datasets
The NWP SAF has been producing datasets such as this for nearly 25 years, with the first released in 2001. It was formed of 13,495 ERA-40 profiles on 60 levels, where only the vertical variability of temperature, humidity and ozone were considered. The current dataset is the sixth in the series and the first to combine meteorological and atmospheric composition (AC) variables selected from one model, which is made possible by rapid simultaneous development of CAMS and the Integrated Forecasting System (IFS) in the last 10 years.
Table 1 lists the 20 variables whose vertical variability is explicitly considered in their own subset, including four new variables that have never featured in any previous version. In addition to these the datasets also contain profiles of vertical velocity, cloud cover and 18 surface variables. For the first time, the whole dataset is now available in netcdf.
| Variable type | Variables | New variables |
| Meteorological (important for NWP) | Temperature, specific humidity, ozone, cloud condensate (liquid & ice), precipitation (rain & snow) | |
| Trace gas | Carbon dioxide, methane, sulphur dioxide, carbon monoxide, nitrogen dioxide, formaldehyde | Nitrous oxide |
| Aerosol | Sea salt (three sizes), desert dust (three sizes), sulphate, organic matter (hydrophilic & phobic), black carbon (hydrophilic & phobic) | Ammonium, nitrate, secondary organic matter (biogenic and anthropogenic) |
Table 1. List of atmospheric variables with their own subset of 5000 profiles, selected to optimise their vertical variability. Species with more than one component (in brackets) are considered together in the selection algorithm.
Reducing voluminous data in three steps
The method for selecting an optimal set of 5,000 profiles for each variable, in order to accurately represent the full spatial, annual and diurnal variability of the original model, is done incrementally in three steps. The first step is to gather a large and evenly sampled number of profiles from the chosen year (March 2024 – February 2025). This is done by obtaining global forecast fields at four lead times (T + 36, 42, 48, 54 hours) initiated at midnight on three fixed days of the month (1st, 10th, 20th), which results in 144 snapshots of the model. The second step reduces this data to a more manageable size by selecting 1500 profiles at each time step using the selection algorithm. Then finally, the same selection algorithm is applied to all the remaining data combined to obtain the 5,000 profiles.
Selection algorithm
The full selection algorithm is in fact based on random selection for 90% of the profiles. This is necessary to preserve the same statistical properties that would be obtained if all model profiles produced in the chosen year were considered. The remaining 10% are carefully selected by finding profiles which are the most dissimilar from one another according to a specific measure of inter-profile difference, which is based on the vertically summed, squared normalised differences between variables on every model level (i.e. Figure 1).
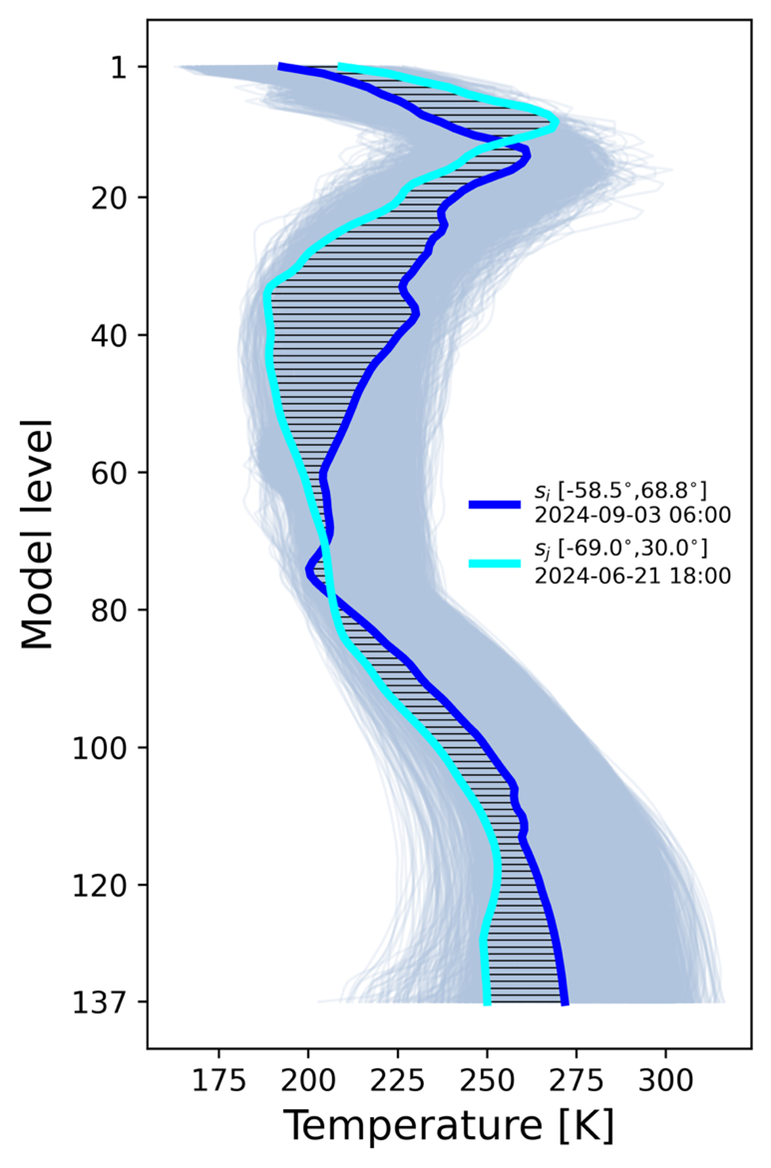
Figure 1. Schematic of two selected temperature profiles with horizontal lines showing the differences between them at each model level.
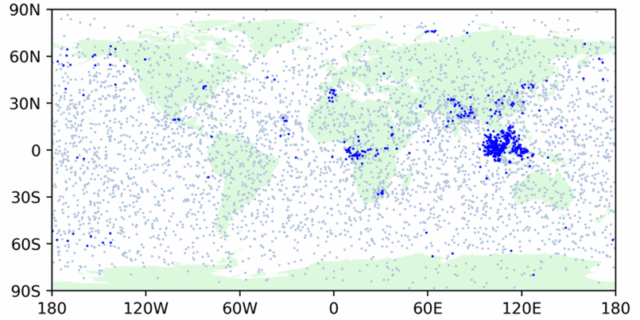
In the example of the sulphate aerosol subset, which is shown spatially in Figure 2, a cluster of profiles selected by virtue of their differences are visible over Indonesia, which could possibly be attributed to the volcanic eruption of Mount Ruang in North Sulawesi on 16th April 2024. Such eruptions are likely to produce more variability in the shape of the profiles than the typical background profiles seen over most of the globe.
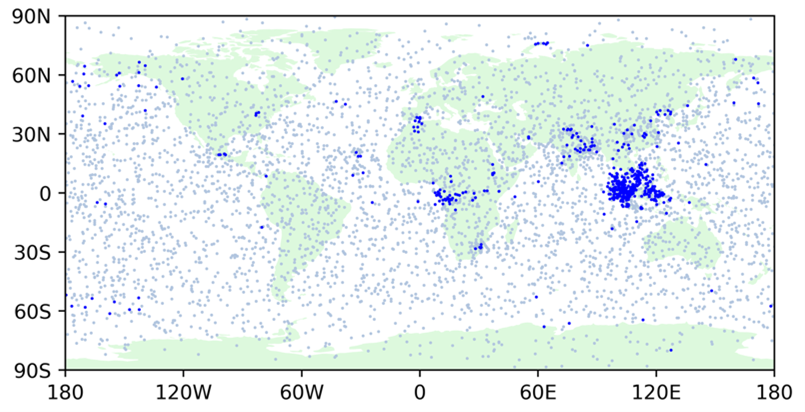
Figure 2. Global distribution of profiles in the new CAMS sulphate aerosol subset. The final 500 profiles chosen for their differences are shown in blue pixels and the 4500 randomly selected profiles are shown in blue grey pixels.
Big changes in NWP and AC profiles
Developments in the NWP models over time have resulted in significant differences in the distribution of profiles with respect to previous datasets. While some variables like temperature, humidity, and even methane, have maintained similar statistical properties, the majority can look quite different in structure, as Figure 3 illustrates.
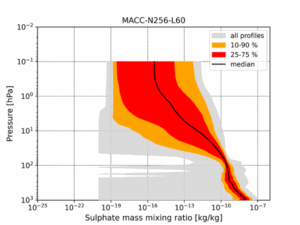
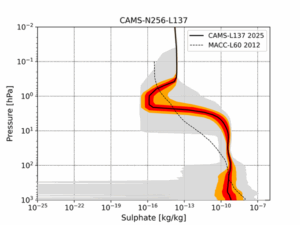
Figure 3. Percentile distributions of sulphate aerosol profiles in the respective subsets of the 2012 MACC (top) and the new CAMS (bottom) databases.
The MACC profiles produced in 2012 show most sulphate profiles tend to decline steadily in concentration as altitude increases, while the range of values increases above the tropopause. In the new CAMS database, however, a lower atmospheric plume maintains a near constant concentration until around 10 hPa where there is a pronounced inversion and a tighter range of values. Similar changes are seen across many of the other aerosol and reactive gases present in the database, many of which can be attributed to the most recent operational change which occurred on 13th November 2024 . It is therefore recommended that the current release be used in place of previous datasets for more accurate simulations.
You can read more about each variable in the documentation and obtain the dataset here