Microwave and Sub-millimetre Spectroscopy for MetOp Second Generation
NWP SAF scientist Emma Turner (Met Office) has produced a literature review on microwave and sub-millimetre spectroscopy focusing on channels of the MWI, MWS and ICI instruments on the upcoming MetOp Second Generation satellite mission due to be launched in the next few years. This review was originally written as Task 1 of a collaborative project entitled, ‘EUMETSAT study on atmospheric absorption models using ISMAR data’
Article by Emma Turner
Background
The MetOp-SG mission will carry three new microwave and submillimetre instruments with novel spectral coverage. The Ice Cloud Imager (ICI) is primarily a sub-millimetre instrument that extends up to 664 GHz and features some channels that have never been present on a spaceborne instrument before (Figure 1). Similarly, the Microwave Sounder (MWS) has a new channel centred at 229 GHz, and the Microwave Imager (MWI) features four channels that makes use of the 118 GHz oxygen spectral line, which has rarely been exploited in satellite sounding in the past but is becoming increasingly popular (Figure 2).
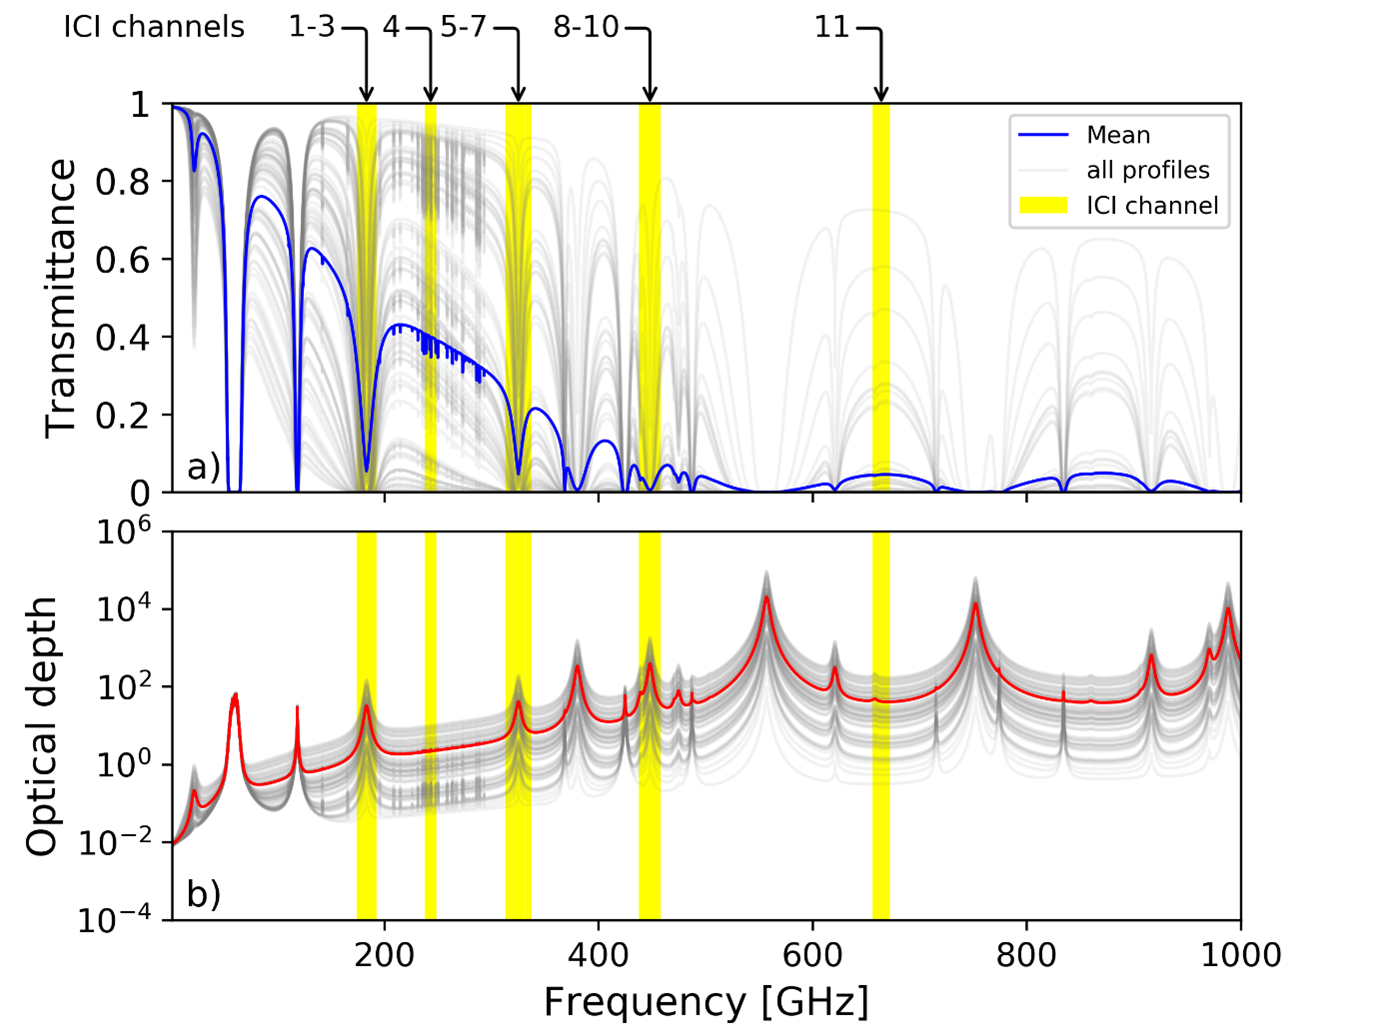
Figure 1. Total surface to space a) transmittance and b) optical depth for 83 diverse atmospheric profiles (grey lines) and their mean (bold lines), produced by the AMSUTRAN line-by-line model. The coverage of ICI channels are shaded yellow.
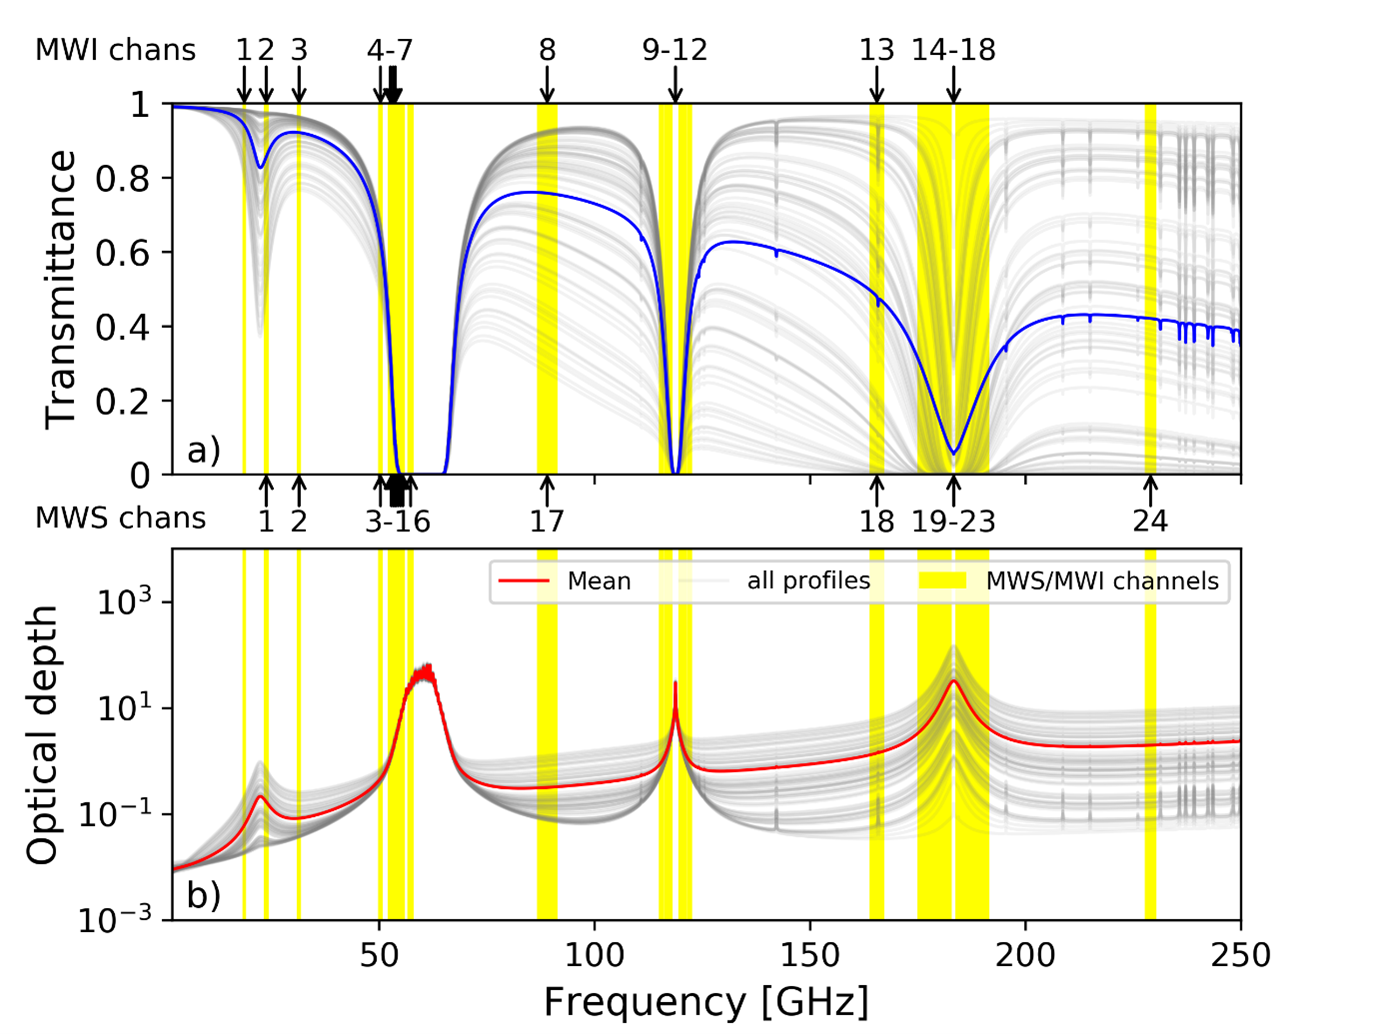
Figure 2. Same as Figure 1. but enhanced for the microwave part of the spectrum below 250 GHz. The coverage of MWI and MWS channels are shaded yellow.
To make use of these unique measurements we need to be able to represent the radiative absorption due to the spectral signature of atmospheric gases accurately (clear-sky), before tackling the next challenge of how to incorporate clouds. As many of these little used parts of the microwave and sub-millimetre spectrum have not been updated in radiative transfer codes for many decades, a review of the literature that has emerged in the intervening time is the first step to learn how to improve our simulation capabilities.
The NWP SAF deliverable RTTOV is a fast satellite simulator and a key component in NWP as the observational operator at most operational centres. Coefficients for microwave instruments are constructed using the AMSUTRAN line-by-line code (line here refers to spectral lines, not lines of code), which uses the MPM series of spectroscopic parameters at its core. (Turner 2019).
What was done?
The literature review first rounded up all major line-by-line codes, line databases and fast satellite simulators – all the tools needed to calculate what the instruments would measure from the top of the atmosphere. Then each major atmospheric gas with influence in that part of the spectrum was reviewed in turn: water vapour, ozone and oxygen. A particular focus was placed on water vapour due to its dominance at sub-millimetre wavelengths, where it renders the atmosphere almost totally opaque, as can be seen by the low transmittances at high frequencies in Figure 1. There are more spectroscopic parameters than can ever be reasonably examined, so the analysis stuck to six of the key water vapour lines and the water vapour continuum. The latter quantity is observed as a spectrally smooth absorption that remains after lines have been deducted and is a bit of a wildcard in the spectroscopic world. Its origin is still quite mysterious even though it has been hotly debated among scientists for over 100 years. Theories tend to fall into two camps: absorption from `dimers’ – pairs of water vapour molecules weakly bound together that produce their own spectra, or the amalgamation of the `cut off’ far wings of ordinary spectral lines from monomers.
What was discovered?
After a thorough examination of all the available data for water vapour lines it fortuitously appears that there has been convergence of values over time for line intensities and air-broadened half-widths, which have a dominant influence on the absorption. This is more evident for the 22 and 183 GHz lines, which have been widely exploited for decades by virtue of their microwave location, than the four sub-millimetre lines at 325, 448, 557 and 752 GHz, which have had much less of a focus. The values describing how these quantities depend on temperature has not converged over time, despite multiple possibilities, and they remain some of the most challenging measurements to make. Describing the way spectral lines shift in frequency due to pressure has gained traction in recent years and more parameters are now available, however, there is still a lack of consensus among values, and even the algorithm to calculate the amount of shift currently takes multiple forms.
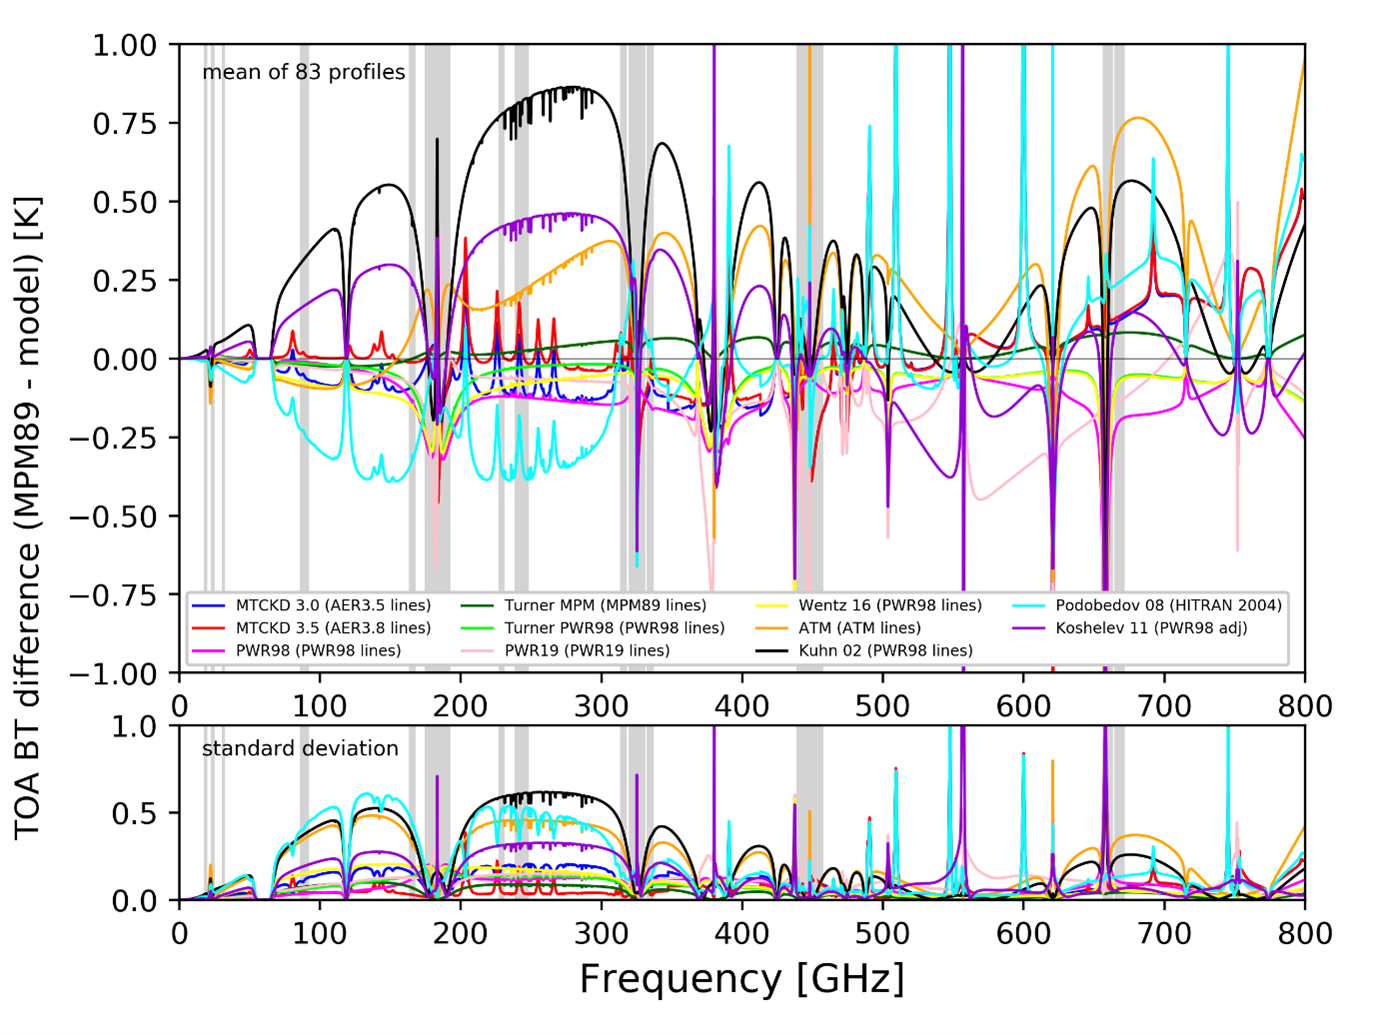
Figure 3. TOA brightness temperature differences between AMSUTRAN/MPM89 and other water vapour absorption models for the mean (upper panel) and the standard deviation (lower panel) of the 83 diverse atmospheric profile set. The key indicates the continuum model and the associated line dataset is in brackets. Simulations are made at nadir using an emissivity of 1. The coverage of MetOp-SG channels are shaded grey.
Of the 11 water vapour continuum models reviewed no single model has been sufficiently validated for both the microwave and the sub-millimetre up to 1000 GHz (where it particularly matters) and also derived at temperatures and pressures characteristic of the real atmosphere, though the MT-CKD model comes close. Figure 3 shows the range of results from these continuum models and their associated spectral lines, as a difference between simulated brightness temperatures over the whole 0-1000 GHz range. Differences are up to 1.25 ±0.7 K in the 200-300 GHz partial window when all models are considered, which has implications for the MWS and ICI channels at 229 and 243 GHz, respectively. The ICI channels at 664 GHz are also in a region of higher spectroscopic uncertainty due to water vapour.
The parameterisation of oxygen absorption has advanced considerably in recent years, in terms of line parameters, line mixing and Zeeman (magnetic line splitting) effects. A dedicated section on the 118 GHz oxygen line reveals the parameters to now be quite well known, due to multiple recent studies, which is good news for the four MWI channels that exploit it. There has been renewed interest in the description of the line shape, for all gases, to account for the effects due to the speed of the molecules.
Over the course of the review, it emerged that spectroscopic parameters tended to broadly originate from two sources: the Russian Academy of Sciences, which have a very prolific literature output resulting from laboratory studies that home in on individual parameters, and Atmospheric and Environment Research (AER), a U.S. based experimental research centre which produce the widely used line-by-line code, LBLRTM. The latter adopt an empirical philosophy for deducing line parameters, using experimental campaigns carried out in the real atmosphere to constrain results. It is recommended that both sets of parameters be compared to give a true range of uncertainty, as they are derived practically independently of one other.
The full literature review on microwave and sub-millimetre spectroscopy for MetOp-SG can be found at: https://nwp-saf.eumetsat.int/site/cdop3-reports-publications/
References
Turner, E., Rayer, P., and Saunders, R. (2019) AMSUTRAN: A microwave radiance transmittance code for satellite remote sensing. Journal of Quantitative Spectroscopy and Radiative Transfer 227 (2019): 117-129.