bullet  EUMETSAT   bullet  SAFs   bullet   NWP SAF   bullet  Monitoring reports   bullet   AMV Monitoring Report

NWP SAF AMV Monitoring

Introduction Monthly
Monitoring
Analysis
Reports
Investigations NWP Real-time
Monitoring
Action List

Types of plots
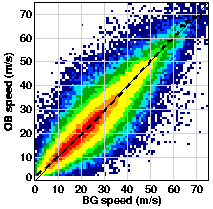
Speed bias density plots
Density plots of observation wind speed against background wind speed for different satellite, channel, pressure and latitude band combinations.
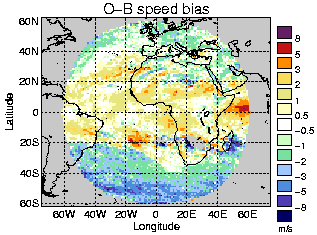
Map plots
Plots of statistics as a function of latitude and longitude for different satellite, channel, pressure level combinations. These highlight geographical areas where there is signifcant mismatch between observations and model backgrounds.
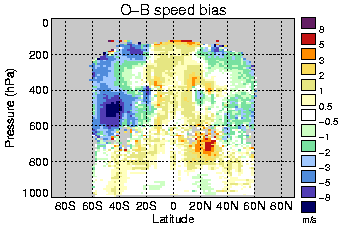
Zonal plots
Plots of statistics as a function of pressure and latitude for different satellite, channel combinations.
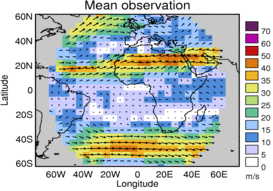
Vector plots
Vector plots showing the mean observed vector, mean background vector and mean vector difference for different satellite, channel, pressure level combinations.

Monitoring Plots

Please select a month

2016 Jan
2015 Jan Feb Mar Apr May Jun Jul Aug Sep Oct Nov Dec
2014 Jan Feb Mar Apr May Jun Jul Aug Sep Oct Nov Dec
2013 Jan Feb Mar Apr May Jun Jul Aug Sep Oct Nov Dec
2012 Jan Feb Mar Apr May Jun Jul Aug Sep Oct Nov Dec
2011 Jan Feb Mar Apr May Jun Jul Aug Sep Oct Nov Dec

For data before 2011, please contact the NWP SAF helpdesk.


Contributors
Met Office - AMV usage in NWP ECMWF - AMV usage in NWP

Guidance for NWP centres contributing to the monitoring.