General
- The Hovmoeller pressure plots binned by time of day
provide a useful tool for detecting diurnal signal in the O-B statistics.
- The diurnal signal, where present, tends to be more
prominent over land than over sea.
- Temporal resolution of some AMV datasets is not high
enough to reliably resolve diurnal pattern (e.g. MTSAT AMVs every 6 hours).
- Caution is required in interpretting spikes in statistics
values where data volumes are low (for example GOES-12 WV TR bias plot).
- For the more significant features seen in the plots
further investigation has been carried out to confirm that the diurnal
signal is a systematic diurnal effect
recurring on several/all days in the period. In some cases it may be due to
an isolated bad event. There may be subtle impacts on the
visible and IR 3.8 results due to changes in the
geographic coverage as the day-night boundary crosses the area.
|
Meteosat-9 (centred 0°, local midnight 0 UTC)
- IR 10.8 NH winds show a signal at
400 hPa (Figure 1). At this level there is a slow (negative) bias of roughly
-1 to -2 m/s between 1800 - 0600 UTC. The bias then increases to a fast (positive)
bias during daylight hours, eventually peaking around mid-day at +3 m/s which also
coincides with a peak in MVD. If we filter by surface type we can see the that the signal is
stronger for winds over land which peak at a bias of +5 m/s (Figure 2)
and much less discernible over the sea (Figure 3). The feature is also
seen, although to a lesser extent, in the Tropics and for the WV 7.3
channel.

Figure 1. Meteosat-9 IR 10.8 NH, all surface types.
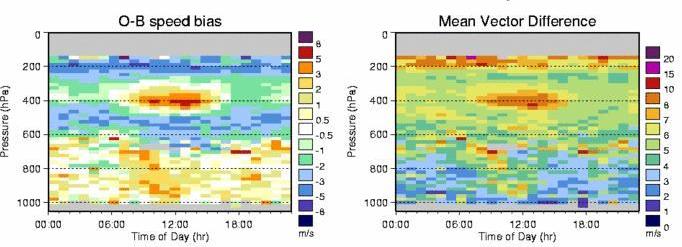
Figure 2. Meteosat-9 IR 10.8 NH, observations over land only.
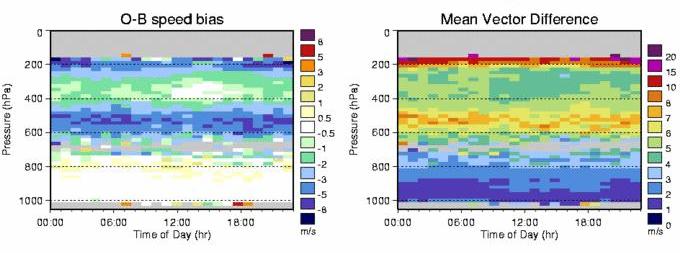
Figure 3. Meteosat-9 IR 10.8 NH, observations over sea only.
Figure 4 shows the IR 10.8 plot for the NH over land, but
filtered by height assignment method. The marked bias is primarily
linked with winds assigned CO2 slicing heights.
We can also plot as a
function of latitude to more precisely narrow down the location of the bias
(Figure 5). The bias is most prominent between 20N-30N which
roughly delimits the central belt of the Sahara and parts of Saudi Arabia.
A specific case on 16 February was investigated further. The fast bias relates
to AMVs produced by tracking cloud associated with
the sub-tropical jet. These fast AMVs (> 60 m/s) are put above 300 hPa at
0 UTC, but closer to 350-450 hPa at 12 UTC. The most probable explanation for
the daytime fast bias is that the CO2 slicing approach is putting the AMVs too
low during daytime hours (peaking at 12 UTC). This could point towards an
inadequate representation of
the large diurnal temperature range of the desert surface, in turn leading to
erroneous height assignments.
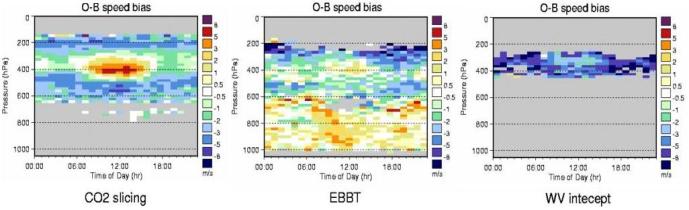
Figure 4. Meteosat-9 IR 10.8 NH for CO2 slicing (left), EBBT (centre) and WV intercept (right) HA methods over land.
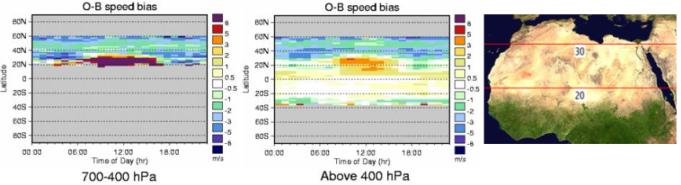
Figure 5. Meteosat-9 IR 10.8 over land using CO2 slicing HA method
for mid-level (left) and high-level (centre) winds. Also, satellite image highlighting 20-30N for approximate Meteosat-9 land coverage (right).
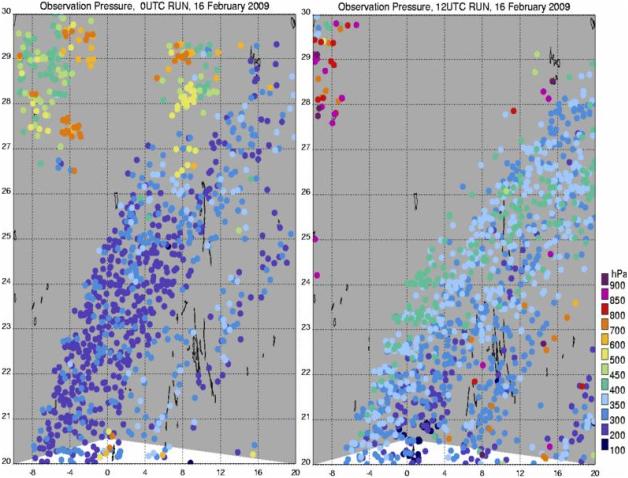
Figure 6. Visualisation plot showing observation pressure for the QU00 (left)
and QU12 (right) runs on the 16th February over a section of the Sahara (-10W, 20E, 20N, 30N).
- There is no signal for IR10.8 winds in the SH and for the WV 6.2 channel at any latitude.
- The HRVIS plots show some diurnal variation e.g.
fast bias in the morning, which is most pronounced over land.
Figure 7 is a similar type of plot but binned by latitude. The most prominent feature is a
fast bias and high mean vector difference around 20N, which persists throughout the
day. This fast bias is most prominent during the winter months when the
jet crosses this area (see Feature 2.7 in the
3rd analysis of the NWP SAF AMV monitoring) and is
probably linked to AMVs being assigned too low in the atmosphere.
Elsewhere, there is a
tendency towards a small fast bias in the morning and a small slow bias in the evening over land,
which is also present in the VIS 0.8 plots.
The mean vector difference tends to be higher at the beginning of the day.
Figure 7. Hovmoeller plot
for Meteosat-9 HRVIS winds over land binned by latitude.
- The distribution of IR and WV winds is relatively uniform
throughout the day, except in the Tropics where there is a peak in the
number of high levels winds and reduced number of mid level winds
between ~1200-2000 UTC.
|
Meteosat-8 rapid scan (centred 9.5°E, local midnight 2320 UTC)
- IR10.8 over land shows a small increase in bias
at 400 hPa and 700 hPa around local midday. However, if we bin the data by latitude
the apparent signal which occurs at ~50°N is only evident for a few days around the 15th
and is not systematic throughout the month.
- The VIS 0.8
channel exhibits a small fast bias towards the end of daylight over sea at 17-19 UTC. This
is based on very few observations so may not be reliable.
|
Meteosat-7 (centred 57.5°E, local midnight 2010 UTC)
- There is a reduced number of IR and WV winds in the
18-19 UTC and 20-21 UTC time bins as shown in Figure 8 for the IR case. This
is related to image quality problems near local midnight during the eclipse
season (solar stray light entering the radiometer). The outages start on
12 February and continue until the end of March.
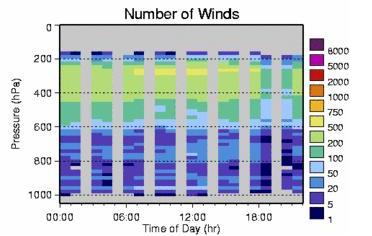
Figure 8.
Meteosat-7 NH IR plot showing a reduced number of winds around local midnight.
We might expect some drop-off in quality of the AMVs
due to solar stray light
problems near local midnight (see Bormann et al.,
2003 (JAM, 42, 1035-1042)). A couple of possible signals are seen in the
Hovmoeller plots.
(1) The NH IR winds show a larger slow bias and MVD at
high levels (~250 hPa) in the two time-slots near local midnight. However, this
was found to be linked to a bigger slow bias at the start of the month rather than a
problem specifically in those time-slots. (2) The IR SH plot shows
poorer statistics in the last time-slot (2230 data).
Time-series plots were also examined to check for
problems in the time-slots either side of those removed at EUMETSAT
(i.e. 1800 UTC and 2230 UTC) and to
check before and after the eclipse outages were enforced (i.e. before 12 Feb and
beginning of April). No significant
impact on the statistics is seen even when no QI filtering is applied.
This is encouraging, although it should be noted that it
doesn't rule out the possibility of some localised impacts on AMV quality
which may be masked in group statistics.
-
- There is a peak in the number of SH WV winds around 1100 UTC.
This coincides with a slightly reduced bias and MVD around 200-300 hPa.
- VIS winds show an increased MVD in the Tropics at
750-800 hPa towards the end of daylight.
|
MTSAT-1R (centred 140°E, local midnight 1440 UTC)
- No diurnal pattern seen, but limited temporal resolution.
|
GOES-12 (centred 75°W, local midnight 0500 UTC)
- No diurnal pattern seen in IR and WV.
- NH VIS winds show a fast bias
and larger MVD around 650hPa at the end of daylight. By contrast the TR VIS
winds over sea show an improving bias and MVD around 700 hPa as the day progresses.
|
GOES-11 (centred 135°W, local midnight 0900 UTC)
- No diurnal pattern seen, but limited temporal resolution
(every 3 hours, but some additional gaps due to
delays in data receipt because of limited capacity on
the Washington GTS link).
|
|