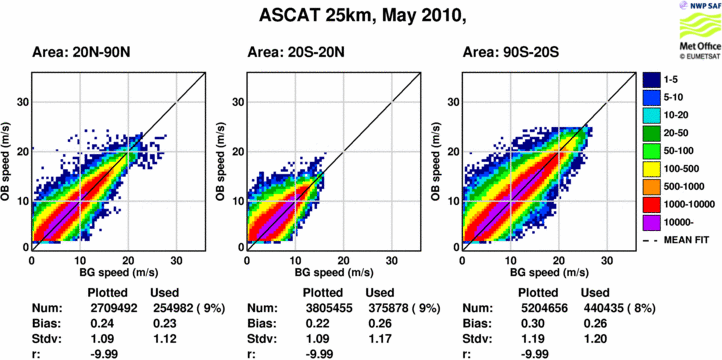
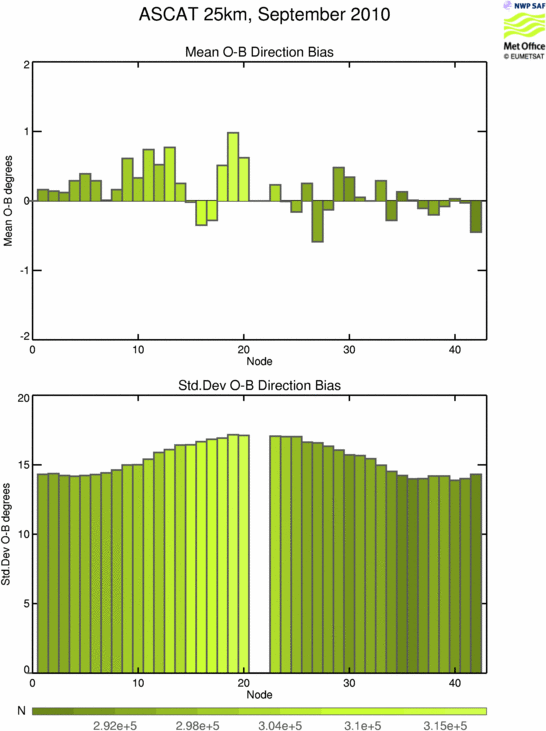
The Met Office monthly monitoring plots show all good quality
winds passing QC, prior to the thinning step.
The density plots also give statistics for the 'used' data
after thinning.
A description of the filtering applied can found on the
following page:
The exceptions to this are
- no bias correction (if applicable) has been applied
to the data in these monthly plots.
This is to allow a fairer comparison between the different
instruments and also to monitor any changes in the wind
products.
- all WVCs are considered.
Hence, although the speed density plots give statistics for
the 'used' data these do not reflect that a bias
correction and WVC filtering may in fact have been applied
prior to assimilation.
|